
Getting to the Data Dashboard
Click the Data tab in the top navigation bar.
Use the time range selector at the top to filter by Last Month, Last Week, Today, or a custom date range.
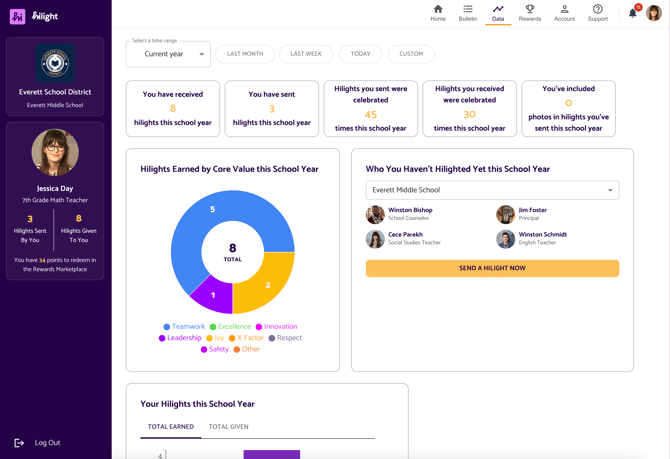
Your personal stats
At the top of the dashboard, you'll see stat tiles showing:
- Hilights received — total hilights sent to you
- Hilights sent — total hilights you've given
- Times your sent hilights were celebrated — how many times others reacted to recognition you gave
- Times your hilights were celebrated — how many times others reacted to recognition you received or sent
- Number of photos you’ve included in hilights you’ve sent (See this article on including photos when sending a hilight!)
Hilights earned by core value
The Hilights Earned by Core Value donut chart shows which of your school's core values appear most in the hilights you've received. It's a great way to see how your colleagues recognize your contributions.
Who you haven't hilighted yet
The Who You Haven't Hilighted Yet section lists colleagues at your school who haven't received a hilight from you this school year. Use the dropdown to filter by school. A helpful nudge to make sure everyone on your team feels seen!
Your hilight activity over time
The bar chart shows your monthly hilight activity throughout the school year. Toggle between Total Earned and Total Given to see both sides of your recognition history.
Up next, learn about how to add photos when sending a hilight